Stable on the Surface But Rising Risks Begin to Pressure the U.S. Economy
National economic indicators remain relatively stable, though there was signs of softening as a fresh geopolitical shock in the Middle East introduced a new layer of uncertainty.
On February 28th, the United States and Israel launched attacks against the nation of Iran after several weeks of threats and military build-up in the region. Iran responded with a barrage of missile and drone attacks across the region, and effectively locking down the Strait of Hormuz, a trade route through which flows one fifth of the world’s oil and gas.
While at the time of this writing, a cease fire had been reached, it can be best described as tenuous. Economists at major financial institutions were quick to model the potential fallout, though estimates vary widely depending on how long the disruption persists and how high energy prices climb.
Even a short conflict is expected to weigh on global growth, though the impact on the U.S. should be less severe than comparable energy shocks in prior decades, according to Wells Fargo. Oil prices reacted sharply to the upheaval, and their baseline forecast calls for prices to settle roughly 30 percent above year-end 2025 levels, dragging global GDP down to 2.9 percent from a prior 3.0 percent estimate.
Wells Fargo economists also expect energy shortages to push inflation above 3 percent in 2026, with risks rising significantly if oil prices approach $130 per barrel. At more moderate levels—around $85 per barrel—the firm estimates the impact on U.S. personal consumption expenditures would be roughly half as severe as similar shocks in the 1980s, reflecting a structural shift in the economy.
Other forecasts highlight the downside risks if the conflict persists. Analysts at J.P. Morgan estimate global GDP could fall by 0.6 percentage points if disruptions extend beyond 30 to 60 days—a threshold that was quickly crossed. Goldman Sachs similarly projects U.S. growth slowing from 2.4 percent to 2.2 percent if oil reaches $100 per barrel, while increasing the probability of a recession by roughly 25 percent. A PNC report from the same period characterizes the conflict as a “general shock to the system,” though it still expects the U.S. economy to weather a limited engagement.
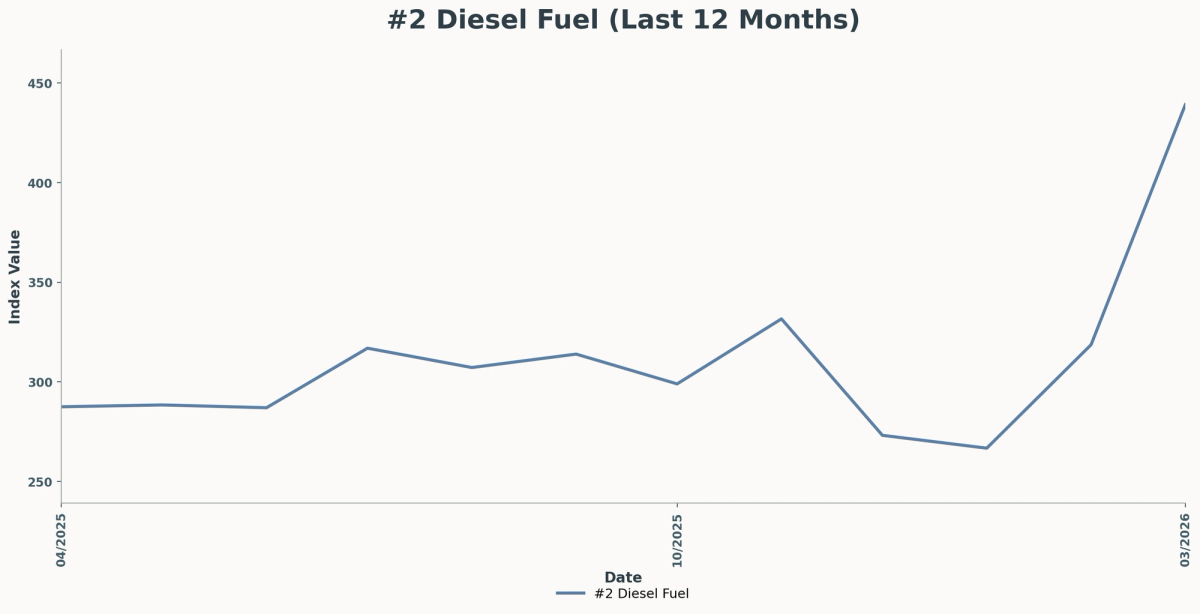
Diesel prices skyrocketed shortly after the conflict with Iran began
Across forecasts, the common thread is increased fragility. Slower growth, higher inflation, and rising uncertainty begin to converge, raising the risk of stagflation. Most project slower consumer and business spending, partially offset by increased government and energy infrastructure investment, resulting in fourth-quarter growth of around 1.8 percent.
Meeting minutes from the Federal Open Market Committee’s March 2026 gathering show policymakers opted to hold the federal funds rate steady, signaling no immediate move toward rate cuts despite earlier market expectations.
The discussion reflects a committee increasingly focused on emerging risks rather than a single dominant trend. Participants noted that while economic growth remains steady and unemployment has held relatively stable, inflation continues to run above target, with recent readings showing upward pressure. At the same time, job creation has slowed, with some weakness attributed to temporary disruptions but broader concerns beginning to surface around labor demand.
Much of the board’s conversation centered on uncertainty. Participants pointed to the recent geopolitical conflict and resulting surge in energy prices as a key variable shaping the outlook, with oil price volatility seen as a potential driver of both inflation and weaker global growth. Financial markets responded accordingly, with a higher implied path for interest rates and declines in equity prices, particularly in technology sectors tied to ongoing AI-related disruption.
Views within the Committee were not uniform. While most supported holding rates steady given the current balance of risks, a minority raised the possibility of easing policy, should labor market conditions deteriorate.
A March Federal Reserve report found that tariffs pushed consumer prices slowly rather than all at once, with Chinese imports showing the sharpest increases. Using item-level spending data from 200,000 U.S. households matched with product-origin details, the study built a Fisher Price Index that closely tracks the official PCE deflator for food, reinforcing the dataset’s credibility. The analysis shows that inflation for imported goods was near zero before April 2025, but after tariff announcements, prices for Chinese goods rose steadily, reaching about 8.5 percent year over year by December, with at least 30 percent of tariff costs passed through to consumers. The report suggests retailers are still absorbing part of the added cost, which may mean further price increases could continue to emerge over time rather than appearing as a single spikes.
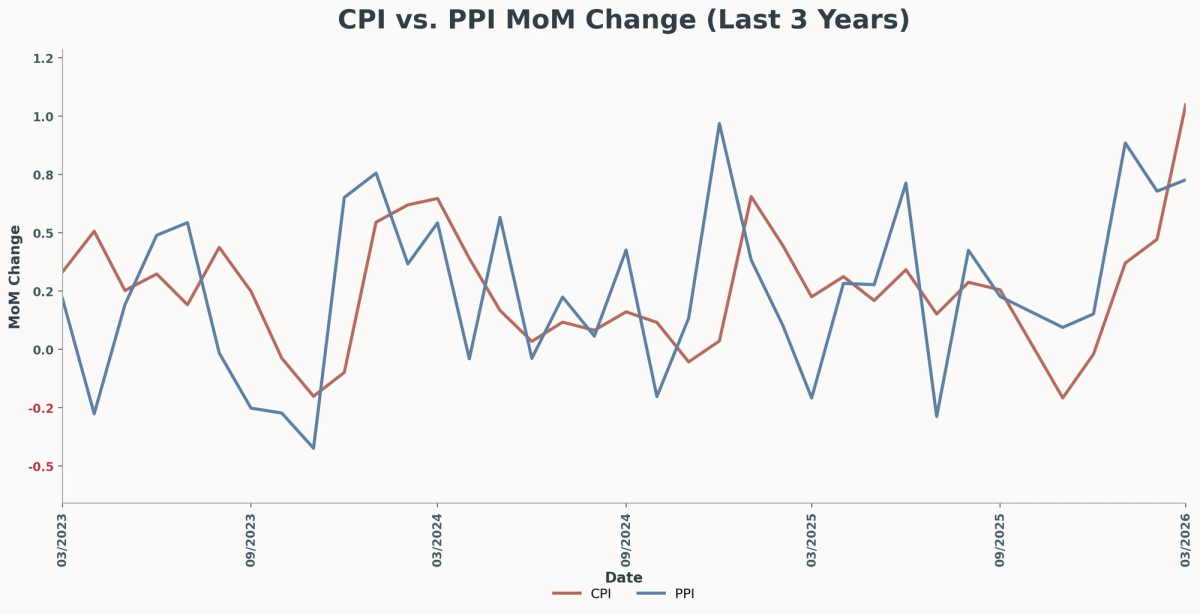
The latest data from the Bureau of Labor Statistics (BLS) indicates the Consumer Price Index has moved by one percent from February to March and is up 3.5 percent year over year. March’s data also reveals that the Producer Price Index has moved by 0.7 percent from February to March and is up four percent year over year.
Inflation roared back after the onset of the war in Iran (Source: BLS)
This surge is largely attributed to a near-record increase in diesel fuel prices and rising prices for key metals. A report from the Association of General Contractors highlighted the pressure on contractors due to these escalating costs, and Ken Simonson, the association's chief economist, noting that “the staggering jump in fuel costs only reflects prices as of mid-March,” indicating the volatility the conflict is bringing home.
Gas prices were felt strongly by the consumer. The University of Michigan’s Index of Consumer Sentiment was one of the lowest levels on record, below readings taken during the financial crisis and COVID-10 pandemic. Sentiment fell 6.6 percent from last month and over 4.6 percent from last year.
The BLS March Employment Situation Report showed the economy added 178,000 jobs while the unemployment rate held steady at 4.3 percent. On the surface, the labor market remains stable, but the underlying growth is narrowing, with gains concentrated in a limited number of sectors rather than broadly distributed.
Health care led the way with 76,000 new jobs, transportation and warehousing added 21,000 jobs, while social assistance contributed another 14,000 positions. Offsetting those gains, federal government employment continued to contract, falling by 18,000 jobs in March and down more than 355,000 since late 2024. Financial activities also declined, shedding 15,000 jobs.
For construction, the report offered a more positive signal. The industry added 26,000 jobs in March after a year of relatively flat hiring, suggesting contractors are still bringing on workers despite elevated borrowing costs, ongoing pressure in commercial real estate, and uncertainty surrounding future federal infrastructure funding. Construction stood out as one of the few major sectors posting meaningful gains, reinforcing the sense that project pipelines remain active even as other parts of the economy begin to soften.
At the same time, wage growth continues to moderate. Average hourly earnings rose 0.2 percent in March and are up 3.5 percent year-over-year, while the average workweek edged down slightly to 34.2 hours. Together, the data points to a labor market that continues holding steady but gradually cooling beneath the surface.
April’s ADP National Employment Report showed private-sector employers added 62,000 jobs in March, reinforcing the view of a labor market that is still growing but at a measured pace. Hiring was led by education and health services, which added 58,000 jobs, followed by gains in information (+16,000) and leisure and hospitality (+7,000).
Elsewhere, the picture was weaker. Trade, transportation, and utilities saw a sharp decline of 58,000 jobs, while manufacturing shed 11,000 positions. Regionally, hiring was negative across both the Northeast and Midwest, pointing to uneven momentum across the country. Growth also remained concentrated among smaller firms. Small businesses added 85,000 jobs, while medium and large employers both reduced payrolls, suggesting that much of the hiring strength is coming from the lower end of the market.
A March report from Associated Builders and Contractors indicates that its Construction Backlog Indicator rose to 8.1 months in February, reflecting a 0.1 month increase from January but a 0.2 month decrease from February 2025. This data comes from an ABC member survey conducted from February 20 to March 6.
The report highlights a sharp increase in backlog for the Middle States, which includes states like Illinois, Indiana, and Ohio, marking it as the only region with higher backlog than one year ago. Furthermore, ABC’s Construction Confidence Index showed improvements in sales and staffing expectations for February, although profit margin expectations declined. All three components remain above the growth threshold of 50.
ABC Chief Economist Anirban Basu noted that while backlog has rebounded from a four-year low in January, it is still low by historical standards, emphasizing the Midwestern region's unexpected economic growth post-pandemic. He mentioned that contractors engaged in data center projects have longer backlogs (11.2 months) compared to those in other sectors (7.6 months).
Basu expressed cautious optimism regarding profit margins over the next six months but raised concerns about potential challenges stemming from rising oil prices which could affect hiring expectations that had recently improved, reaching their highest level since March 2025.
A March report from Dodge Construction Network shows that planning activity pulled back at the start of 2026, before construction activity rebounded a month later. The Dodge Momentum Index (DMI)—a monthly measure of nonresidential projects in planning, based on a three-month moving average and typically leading construction spending by one to 18 months—fell 7.3 percent in February to 250.0, down from a revised 269.8 in January.
Commercial planning declined 8.9 percent, while institutional planning slipped 4.0 percent. Dodge Associate Director Sarah Martin noted that “planning momentum continued to normalize… after a surge in activity in the back half of 2025,” suggesting the pullback reflects cooling rather than a broader contraction. Despite the monthly decline, the pipeline remains elevated, with the index up 18.7 percent year-over-year and institutional activity still showing notable strength.
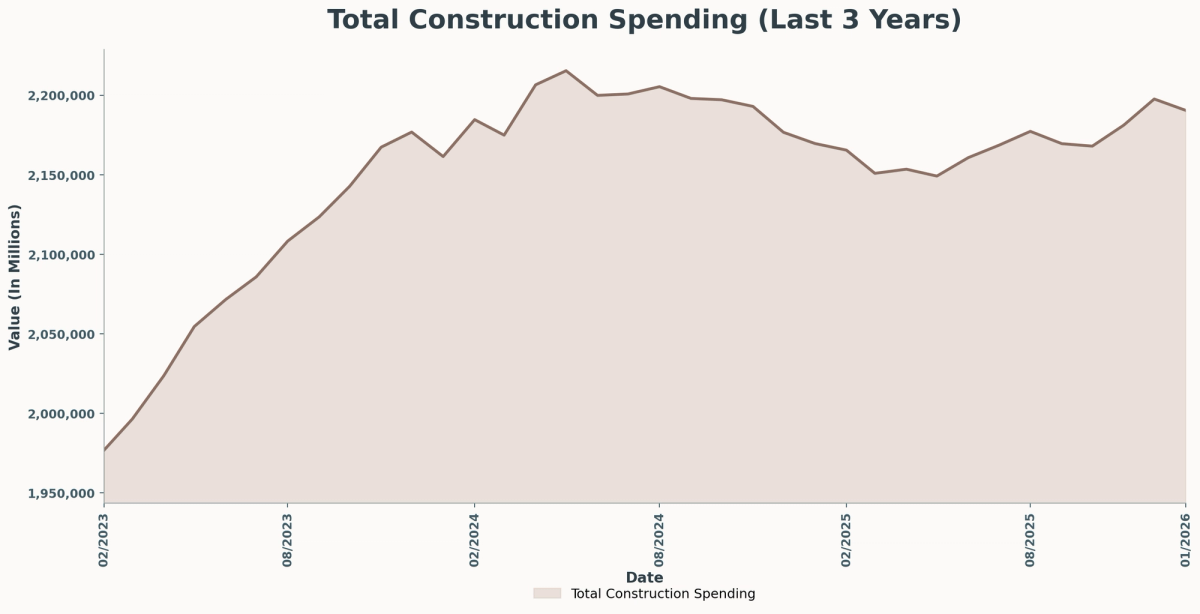
Total construction spending dips in the first quarter of 26. (Source: BLS)
That softer planning data was followed by a rebound in actual construction activity. According to Dodge’s April 17 report, total construction starts rose 12.8 percent in March to a $1.22 trillion seasonally adjusted annual rate. The increase was driven largely by nonbuilding construction, which surged 37.9 percent on the strength of several major electric power and utility projects. Nonresidential building starts rose a more modest 6.3 percent, while residential construction edged up 2.6 percent, supported by multifamily gains even as single-family activity declined.
Taken together, the two reports point to a market that is stabilizing rather than accelerating. Planning activity has cooled from late-2025 highs, with broad-based declines across commercial and institutional sectors, while construction starts remain uneven and heavily influenced by large, project-driven swings—particularly in infrastructure and energy. Risks tied to costs, labor availability, and geopolitical uncertainty continue to weigh on near-term confidence, but the still-elevated planning pipeline suggests that stronger construction spending may reemerge further out.
A late April report from the Associated General Contractors of America (AGC) indicates that construction employment increased in 30 states and the District of Columbia between February 2025 and February 2026. Twenty states experienced job growth from January to February 2026. However, association officials noted signs of slowing construction activity in various regions.
For now, the economy remains stable, but underlying distress signals are present. Growth is slowing, risks are rising, and momentum is increasingly uneven across sectors and regions. In construction, that translates to a market that is still active, but more volatile and more selective than it appears at first glance. Further shocks to oil could make a serious impact, so the key variable now is the conflict with Iran. How long it persists will influence its effects on energy prices and global trade.